Many patients with heart conditions, such as congestive heart failure, must track their fluid input an output levels to reduce risk of an adverse event. The main indicator is edema, which is when fluid is being trapped in the body. Many patients are asked to keep track of how much they are urinating and must urinate into a bottle or an expensive contraction. This is a device that keeps track of liquid out just using one temperature sensor... Making getting this data potentially cheaper and more convenient.
Use a simple temperature sensor inserted into the toilet bowl water to predict the volume of urine into the toilet. If the temperature sensor is confident of the starting temperature, and assumes that all liquid coming into the bowl is at body temperature, the volume of the liquid can then be calculated using the base formula for heat (q) based on a temperature gradient (ΔT), mass (m) and c (specific heat of water): $$ q = mcΔT $$ Assume heat is conserved between the start and end state (fully inelastic collision) and that two bodies of water at the starting state become one body of water at the end state. $$ m_1cT_0 + m_2cT_1 = (m_1+m_2)cT_2 $$ Heat capacity of water is assumed constant, so c drops out: $$ m_1T_0 + m_2T_1 = (m_1+m_2)T_2 $$ Rearranging to solve for the displaced mass, m2. $$ m_2 = (m_1T_2 - m_1T_0)/ (T_1 - T_2) $$
Volume (V) of water displaced is calculated from density d_water given a known mass of displacement: $$ V_{displaced} = m_2/d_{water} = m_1(T_2 - T_0)/ (d_{water}(T_1 - T_2)) $$
Thus, the displaced volume of pee in a toilet can be estimated using temperature and a rough estimate of the starting volume of liquid.
Example calculations:
Let's start with 3 kg of water in the toilet bowl at 290K, and 310K for the body temperature of pee. If the final temperature is 295K, let's calculate the mass of pee:
$$ m_{pee} = m_1(T_2 - T_0)/ (T_1 - T_2) = 3(295-290)/(310-295) = 3*5/15 = 1.0 kg $$
1.0 kg would be a large amount of pee on the upper end of what a person would produce. We can start to see that the largest pee, would require the temperature sensor to register a 5 degree (K) change.
The temperature sensor, at room temperature would be able to detect about 0.1 kg for every 0.5 degree change in temperature. The average amount of pee produced in a day is between 0.8 and 2.0kg, so the error over the course of the day would be on the order of 5-10%. A person pees between 5 and 10 times a day, meaning the average pee would be around 0.2 kg, which would probably translate to around a 1 degree relative change in temperature. Because we only care about the relative change in temperature, the absolute temperature measurement is less important.
I filled up a pyrex with 0.5 kg tap water measured to be 38.0 C with a FLUKE 62 MAX+ IR Thermometer and poured it into the toilet bowl that had bowl water measured to be very stable at 11.8 C. The resulting temperature of the combined water in thee toilet bowl was around 13.8 C +/- 0.2 C.
First thing is I calcuated the capacity of the toilet bowl using the formula and got 6.05 L, which is 1.598 gallons. This confirms the toilet is 1.6 gallon/flush toilet.
@staticmethod
def calc_toilet_bowl_capacity(init_temp_toilet,final_temp_toilet, known_volume_pee):
    # get temps in kelvin
    T0 = Poopy.temp_in_kelvin(init_temp_toilet)  # toilet temp before pee
    T1 = Poopy.temp_in_kelvin(bodytemp)  # temp of pee
    T2 = Poopy.temp_in_kelvin(final_temp_toilet) # final temperature of toilet bowl water after pee
    m = known_volume_pee
    toilet_bowl_capacity = m*(T1-T2)/(T2-T0)
    return toilet_bowl_capacity
print(Poopy.calc_toilet_bowl_capacity(11.8,13.8,0.5))
>>> 6.049999999999997
Now, going with the assumption the toilet is in fact a 1.6 gallon/flush toilet, I tried to estimate the amount of liquid poured into the bowl - the "pee".
@staticmethod
def calc_poopy(init_temp_toilet,final_temp_toilet,init_mass_of_water_in_bowl):
    # get temps in kelvin
    T0 = Poopy.temp_in_kelvin(init_temp_toilet)  # toilet temp before pee
    T1 = Poopy.temp_in_kelvin(bodytemp)  # temp of pee
    T2 = Poopy.temp_in_kelvin(final_temp_toilet) # final temperature of toilet bowl water after pee
    m = init_mass_of_water_in_bowl
    mass_of_pee = m*(T2-T0)/(T1-T2)
    return mass_of_pee
print(Poopy.calc_poopy(11.8,13.8,m_init))
>>> 0.5005537190082647
Wow. The theory returned 0.501 kg as the result! More samples are needed to say anything with statistical meaning, but it appears the volume of pee was estimated correctly within 1g just using temperature and the knowledge of the flush capacity of the toilet.
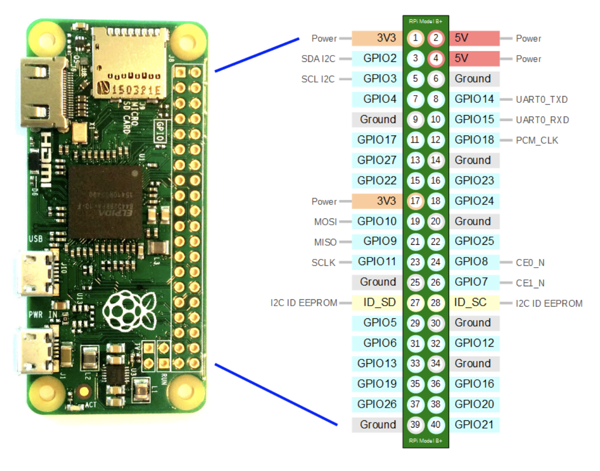
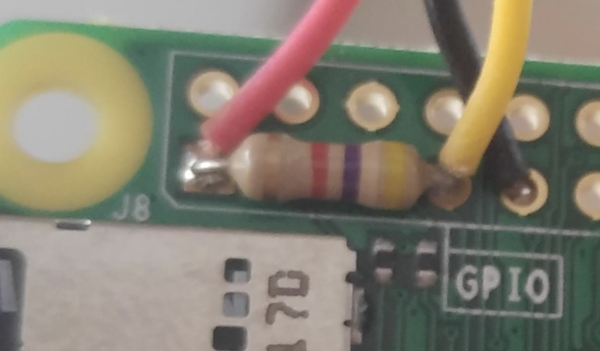
Materials: DS18B20 Temperature Sensor, Raspberry Pi Zero W, 4.7K resistor
GPIO1 - 3.3V, GPIO6 - Ground, GPIO15 - UART0_RXD
Raspberry Pi Zero W GPIO Diagram:
Simple Circuit Diagram connecting Raspberry Pi Zero W to DS18B20 temperature sensor with 4.7K Pull Up Resistor:

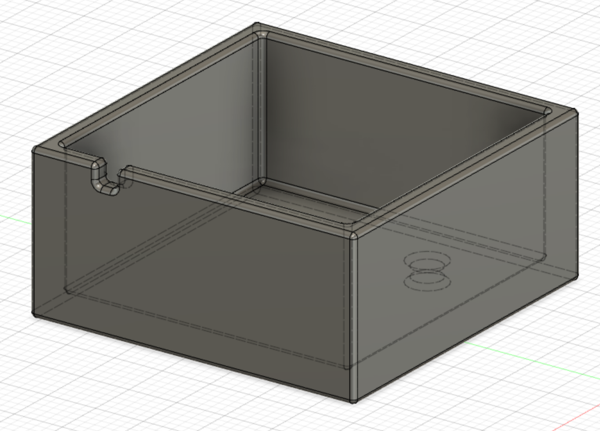
Simple Case design created in Fusion 360:
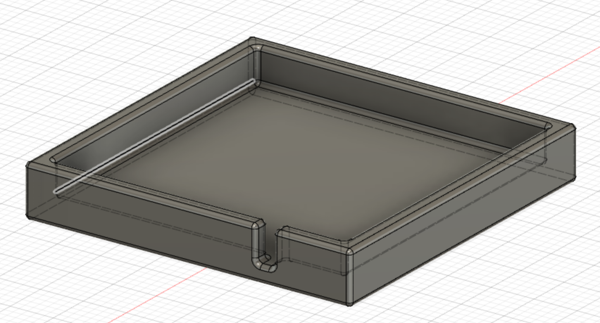
Case bottom:
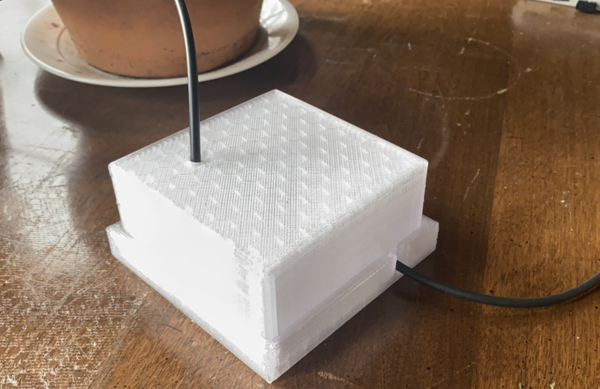
The 3D printed case looks good:
The Temperature log from the Rasp Pi from SSH in Mac Terminal looks like it's reading properly:

Now that we have a device that logs temperature, we need a way of automatically detecting pee events. Alternatively, these events can be tagged with a physical button or through an app. The advantage of a button approach, is that it helps separate data for different people using the bathroom.
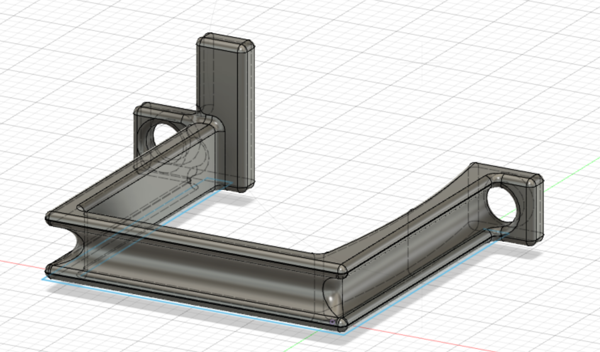
This first design is a clip on the side of the toilet bowl that directs the wire and sensor to sit in the water of the toilet bowl.
First Design v0.1
Making the design more 3D printer friendly v0.2:
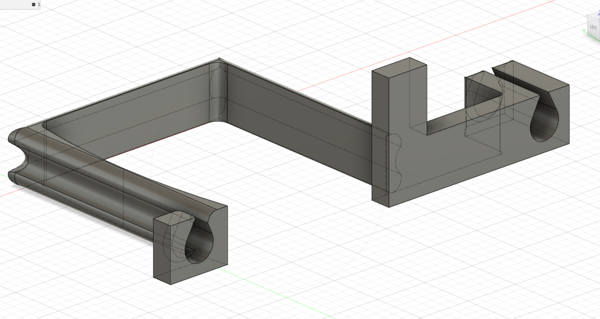
The output print works - it fits on the toilet rim and successfully orients the temperature sensor. For next time, the design could be slightly more stiff and thicker. The plastic feels flimsy. I think this is because a global fillet was applied that removed a lot of the material. Ideally, the thickness would be closer to 0.2in for this material, giving the clip a tighter snap. Another minor consideration would be to make the wire guides a little more closed so the wire cannot slip through the teardrop slot.
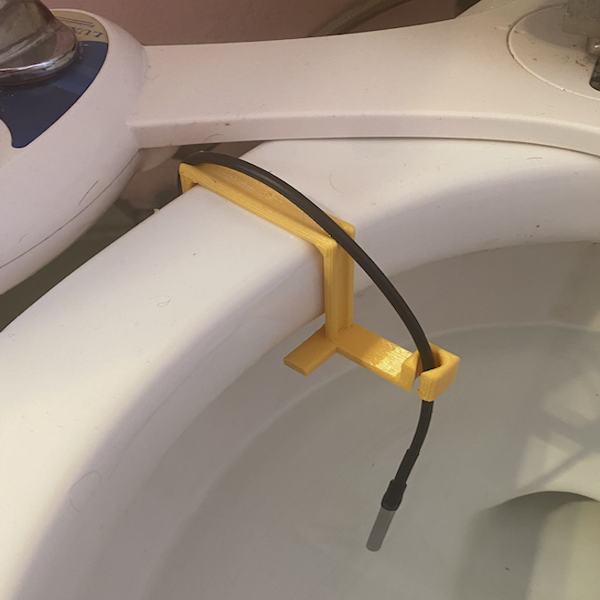
Here is the clip in action:
sudo nano /etc/rc.local
In rc.local, add the following code to run the script as a background process (&).
sudo python3 /home/poopy/poopytime/main.py &
The data is recorded into a local CSV file for now with the following categories: Current Temperature, Mean Temperature (of 10 readings over 5 seconds), Base Temperature of Toilet Water, The Date / Time, and the estimated volume of pee.
if (temp > (cb.mean + 0.125)):  # if current temp > mean of last 10 readings + 0.125 C
    if first:
        basetemp = cb[0]  # take first element of circ buff as the base temp
        first = False

    #  Write out data
    data = [temp, cb.mean, basetemp, datetime.datetime.now(),P.calc_poopy(basetemp,temp)]

    with open('data.csv','a', encoding='UTF8') as f:
        writer = csv.writer(f)  # write data to csv file
        writer.writerow(data)
The CSV output shows that pee events are successfully detected. This is important as recording every temperature reading uses a lot of memory. The use of the circular buffer also keeps memory use light on the raspberry pi, and increases chances that the program will keep running without crashing.
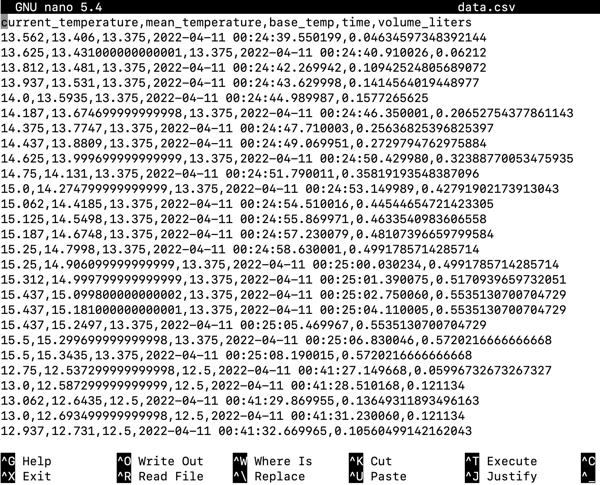
Ideally, this program is probably best written in a language like C to ensure greater reliability, but for now, we use python for convenience reasons. Looks like for a v0, this is working well!
In the US, most toilets are either 1.6 gallons or 1.2 gallons flush capacity.
To calibrate the device, pour a exactly a liter or 0.5 liter of boiling water into the toilet. This will register as a very large pee greater than 2 Liters assuming body temperature. Once it sees that the pee amount is much more than a bladder capacity, it will calculate the toilet bowl size assuming 1L of boiling water was added. The system will assume, to start, that toilet bowl sizes are either 1.2L or 1.6L.
Here is example code:
def calibrate(init_temp,final_temp):
    toilet_vol = P.calc_toilet_bowl_capacity(init_temp,final_temp,c['BOILING_IN_KELVIN'],c['CALIBRATION_VOL'])
    thresh = 0.5  # error threshold in liters
    print(abs(toilet_vol-c['BIG_FLUSH']))
    if abs(toilet_vol-c['SMALL_FLUSH'])<thresh:
        c['INITIAL_MASS'] = c['SMALL_FLUSH']
    if abs(toilet_vol-c['BIG_FLUSH'])<thresh:
        c['INITIAL_MASS'] = c['BIG_FLUSH']
    return toilet_vol, c['INITIAL_MASS']
I'm running into challenges debugging the code via the raspberry pi as it relates to the logic on the main loop. The challenge is that criteria must be set for when a pee event initiates and is completed. There is no perfect criteria - the aim is to select criteria that is responsive and accurate. Implementation via the following informal specification appears to improve reliability of the code.
Initialize variables temp reading interface circular buffer result Add temp to circular buffer if check if pee happening: find the base temperature update max temperature calculate max volume else (temp is stable): if result is pee: write volume and timestamp to file reset state if result is calibration: calibrate system reset state
This will ensure that the python script continues to run as a service and boot back up when the pi is reset.
Put the following code at the top of the main.py script:
#!/usr/bin/python3
Create a file in: /etc/systemd/system called toilet.service with the following content:
[Unit]
Description=Toilet
After=multi-user.target

[Service]
Type=simple
ExecStart=/usr/bin/python3 /path/to/main.py
Restart=on-abort

[Install]
WantedBy=multi-user.target
sudo chmod 644 /etc/systemd/system/toilet.service
chmod +x /home/pi/hello_world.py
sudo systemctl daemon-reload
sudo systemctl enable toilet.service
sudo systemctl start toilet.service
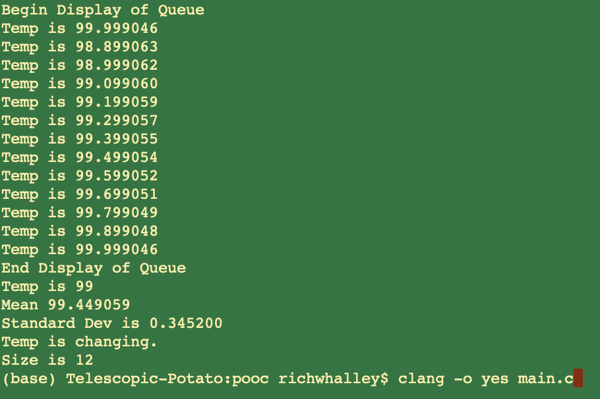
Implemented a queuing system and a basic analysis using standard deviation to track if temperature is changing. Next step is to add code to read the DS18B20 temperature sensor on the Raspberry Pi. Here is a reference: https://albertherd.com/2019/01/20/using-c-to-monitor-temperatures-through-your-ds18b20-thermal-sensor-raspberry-pi-temperature-monitoring-part-3/ The C code can be run on a Raspberry Pi Pico or a microcontroller, although connectivity still needs to be addressed. The hc-06 bluetooth module can be interfaced with a Raspberry Pi Pico and send data to a mobile device via serial comm over bluetooth.
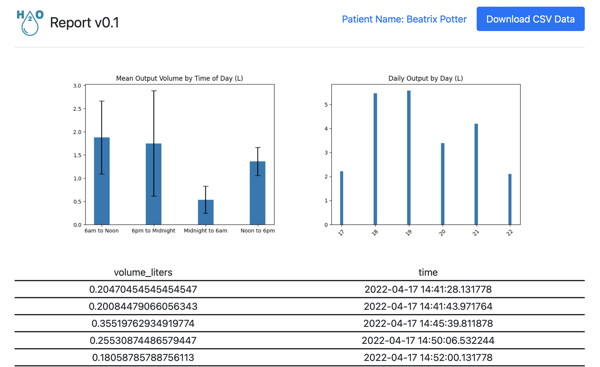
This webapp runs on an apache2 server on the local network. It uses matplotlib to generate the graphs, which works OK for a basic prototype. The data is currently stored using CSV files. Later on, it will be moved to a SQL database and graphs will be generated in the browser using javascript on the local machine rather than on the raspberry Pi. Installing and running a library like matplotlib on a raspberry Pi creates unnecessary complexity and can cause potential reliability issues. It also takes a long time to install as the library is overpowered for what is needed: a basic set of bar graphs.
First version of the prototype is ready to go! Next steps are to test the system for accuracy and do a trial run with patients, comparing to logging manually, or with the fancier system. There are possibilities to integrate more ideas to make a more interesting feature set. I've put this project on pause for now, but hope to pick it up soon again in 2023.